← → Space · Scroll · Click dots
01 / 19

Mintveo×Beesline

Marketing, measured

Outline
02 / 19
What we'll cover

Today's walkthrough.

01
The customer

Sarah's week across four platforms.

02
The gaps

Three reasons today's measurement keeps falling short.

03
The shift

How modern marketing modeling actually works.

04
Mintveo

The team, the platform, the data we need.

01 · The customer
03 / 19
Persona

Meet Sarah, the modern shopper.

Sarah, 29, skincare buyer
Name Sarah
Age 29
Profile Skincare buyer
Shops Skincare, wellness, beauty
Buys 2–3 products / month
Decides Evenings & weekends
Digital habits · always on
Phone Work laptop Personal laptop Tablet
01 · The customer / Day 1
04 / 19
1 Mon · Instagram 2 Wed · YouTube 3 Thu AM · TikTok 4 Thu PM · Google
Day 1 · Monday

She sees an ad on Instagram, clicks through, browses, leaves.

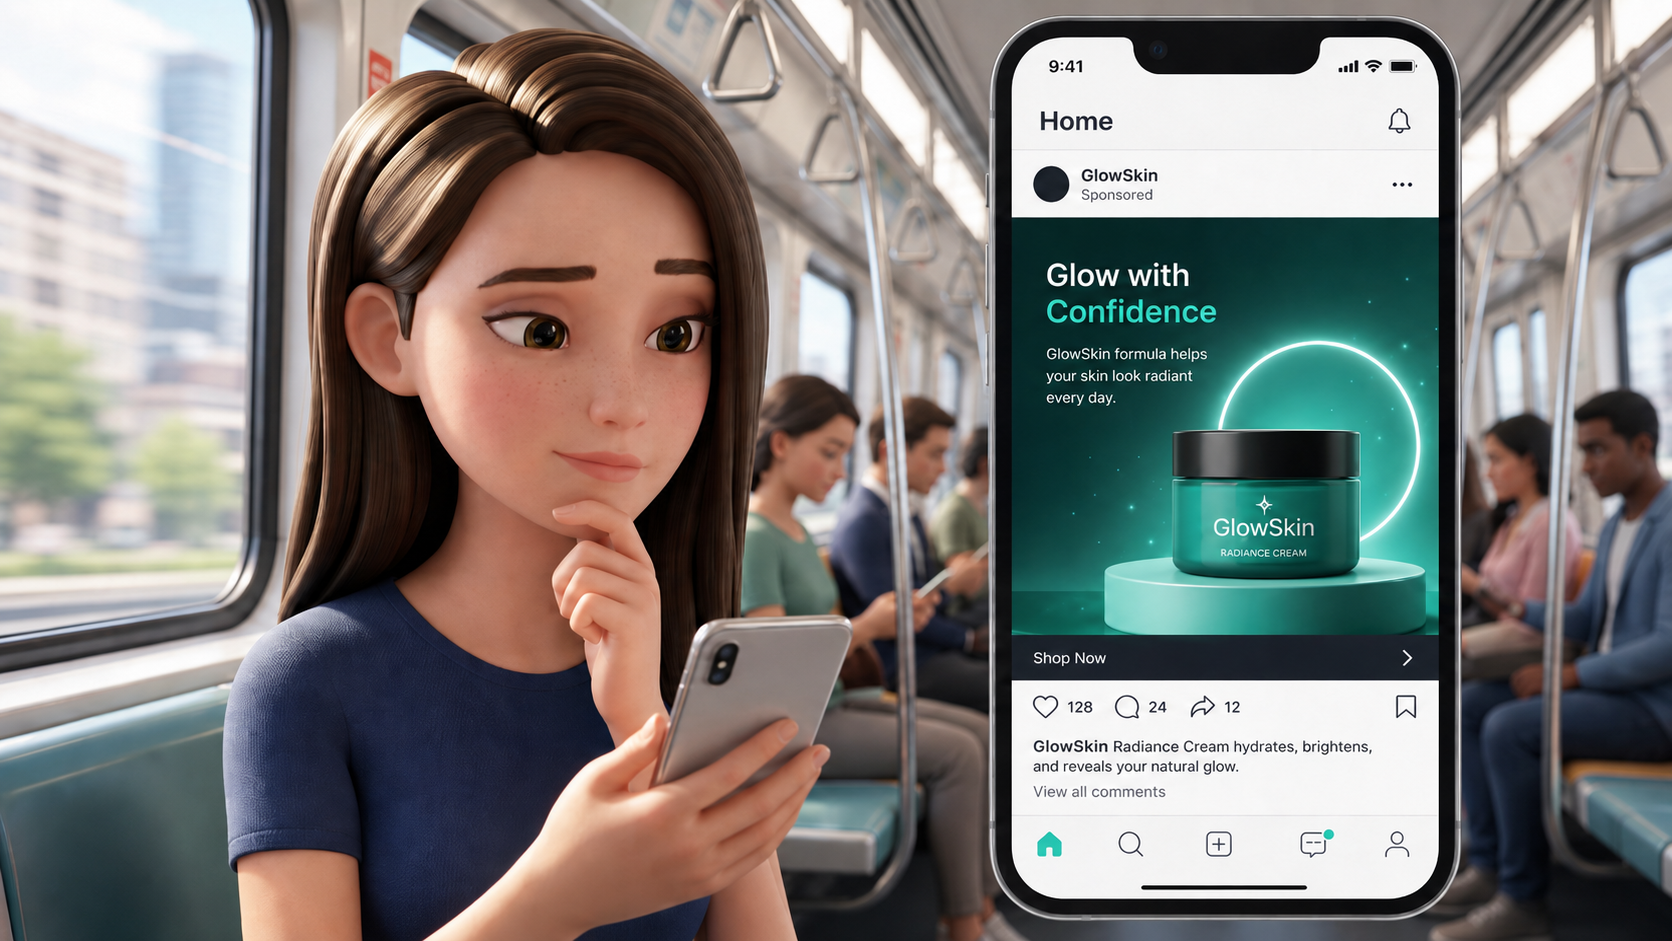
No purchase. The pixel records a view, a click, a session of 47 seconds.

Sarah on the subway, looking at a GlowSkin Instagram ad on her phone
01 · The customer / Day 2
05 / 19
Mon · Instagram 2 Wed · YouTube 3 Thu AM · TikTok 4 Thu PM · Google
Day 2 · Wednesday

A skip ad runs on YouTube. She watches 15 seconds, then skips.

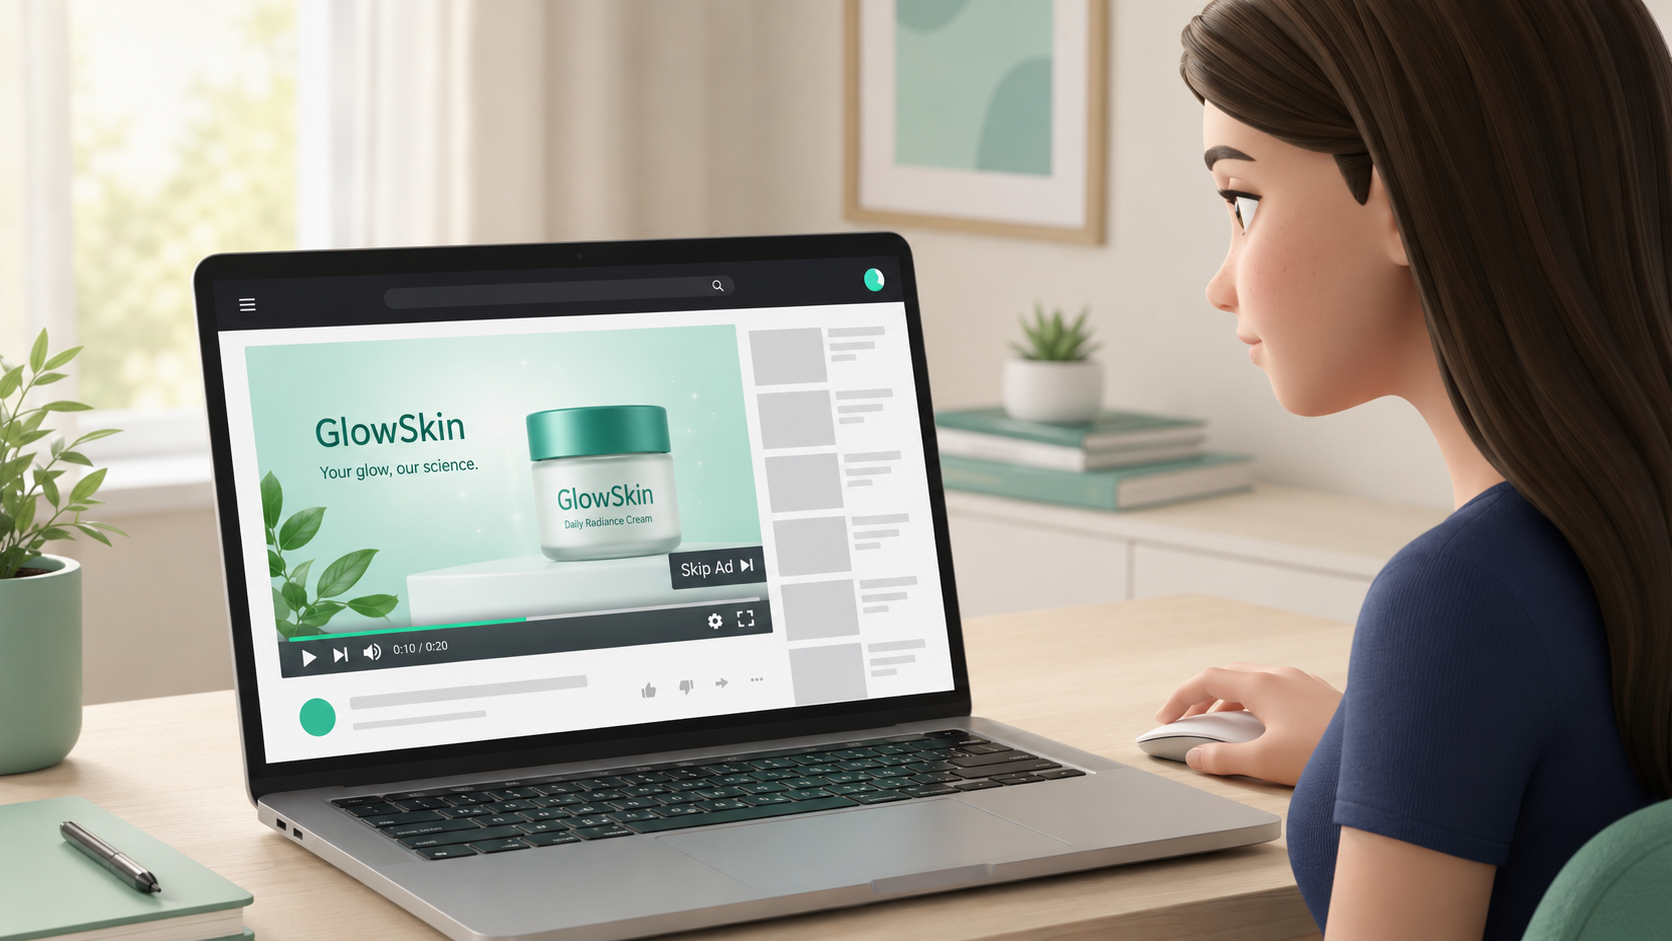
Brand exposure recorded. No click. No site visit. No conversion attached.

Sarah at her desk, watching a GlowSkin YouTube pre-roll ad
01 · The customer / Day 3 AM
06 / 19
Mon · Instagram Wed · YouTube 3 Thu AM · TikTok 4 Thu PM · Google
Day 3 morning · Thursday

TikTok serves an in-feed ad. 4 seconds in, she scrolls past.

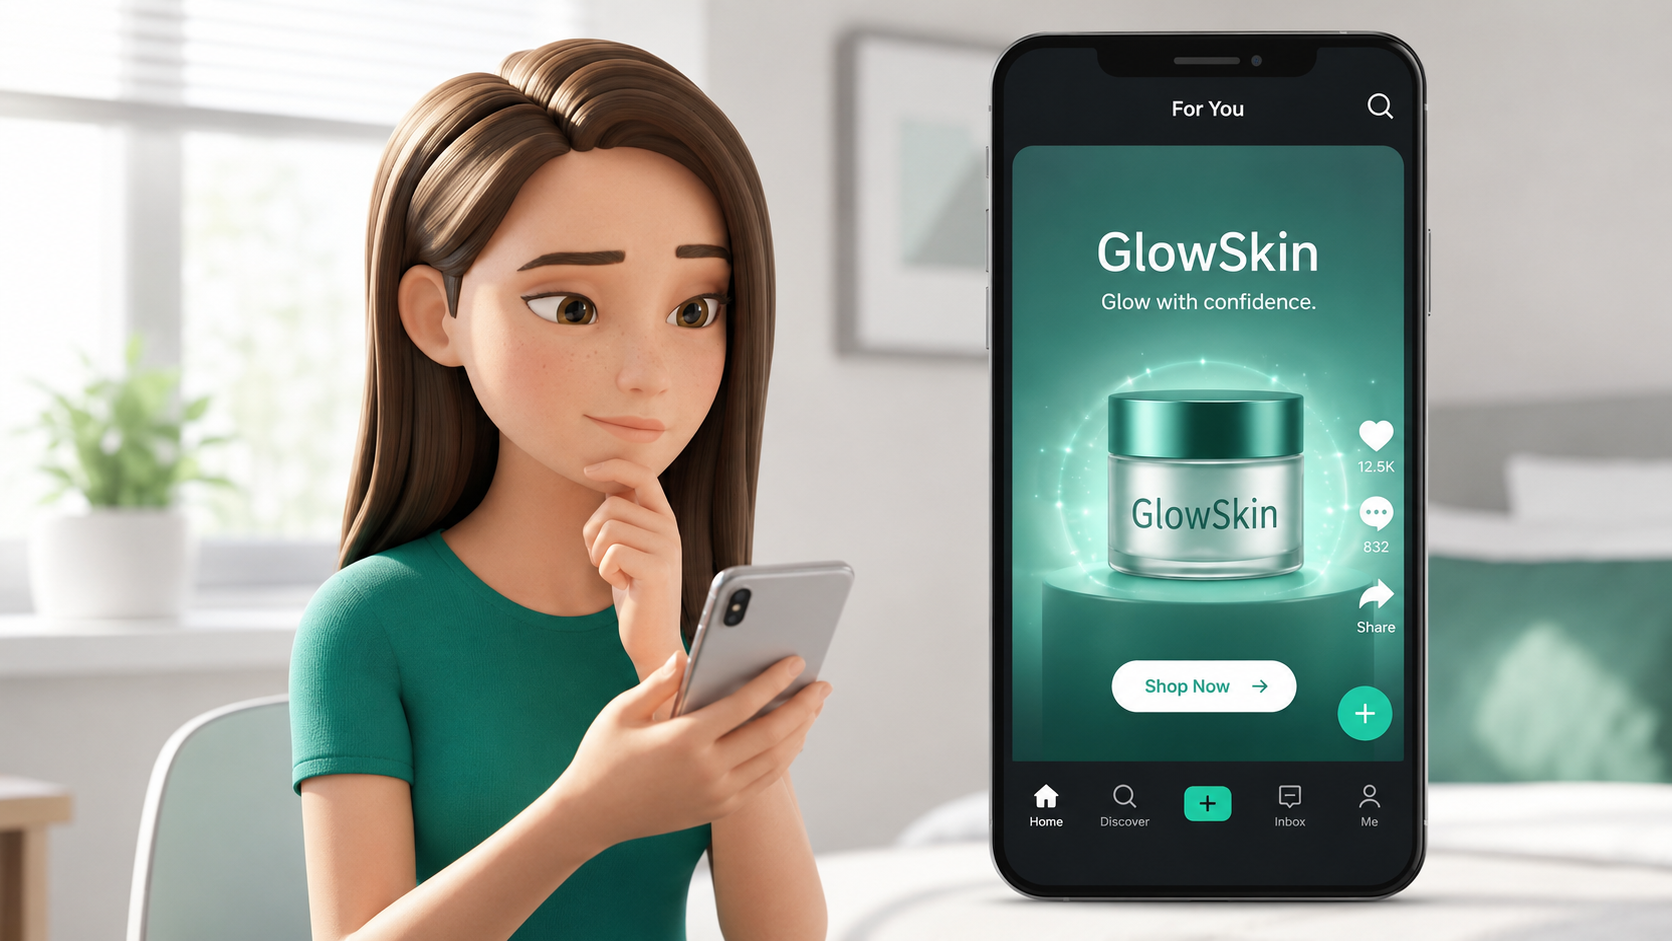
No click. No site visit. The platform records an impression and a scroll-away event.

Sarah holding her phone, scrolling past a GlowSkin TikTok in-feed ad
01 · The customer / Day 3 PM
07 / 19
Mon · Instagram Wed · YouTube Thu AM · TikTok 4 Thu PM · Google
Day 3 afternoon · the conversion

She types "GlowSkin" into Google, and buys for $120.

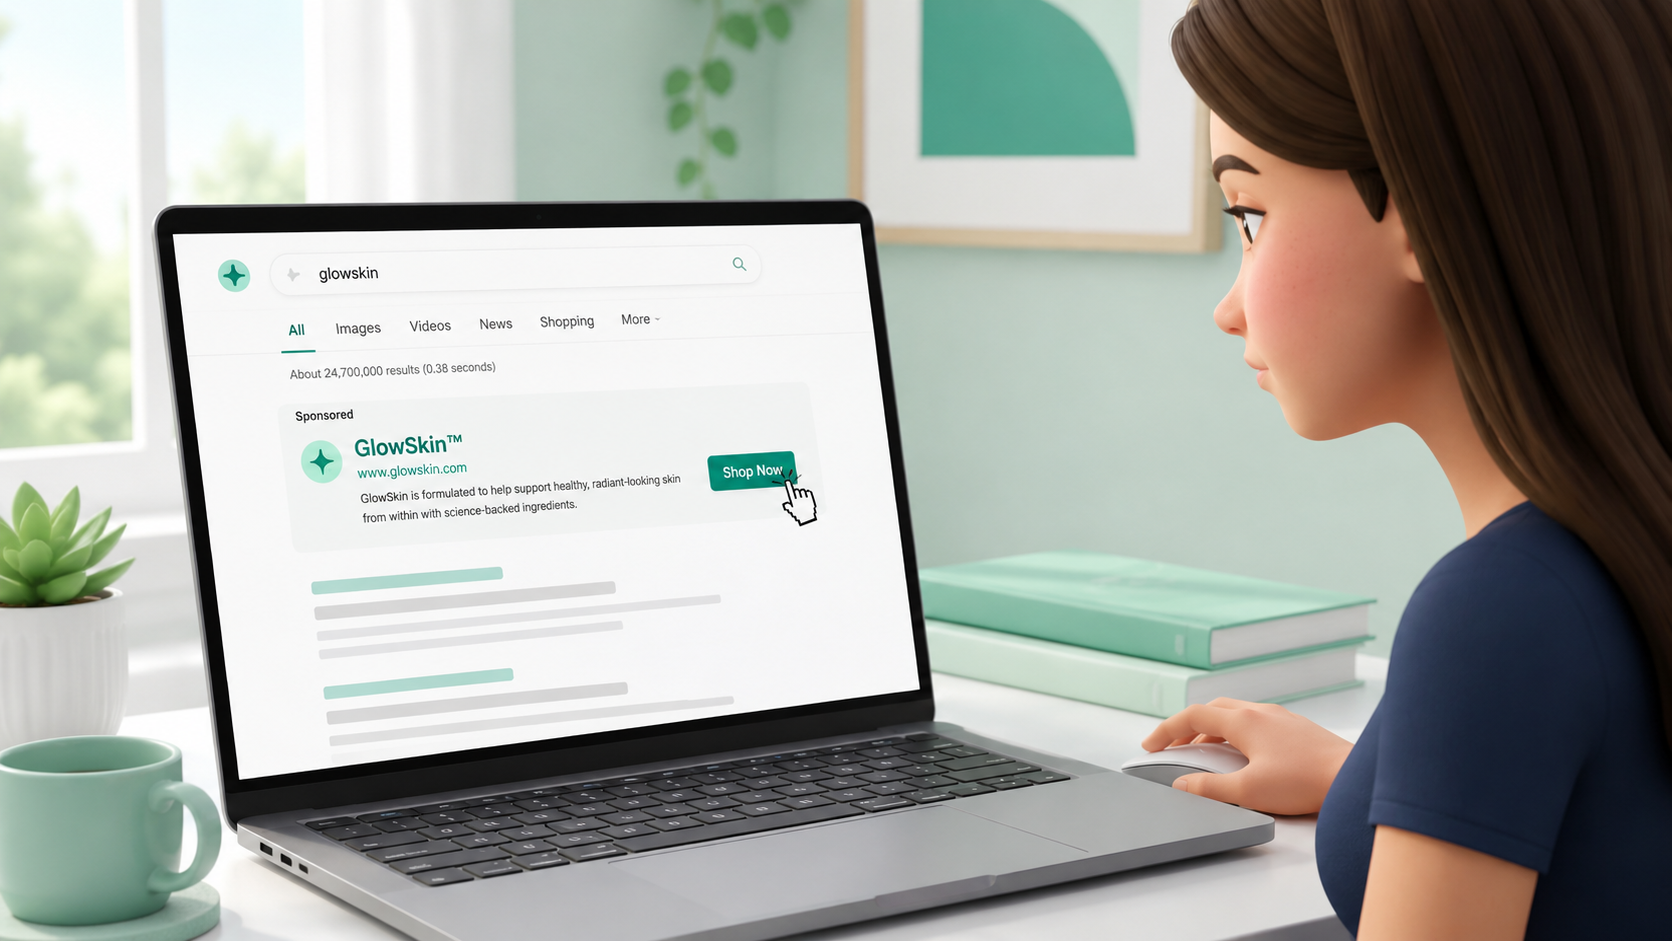
Branded search, last click. The receipt lands in inbox. The purchase is recorded.

Sarah at her desk, clicking GlowSkin's branded result on Google search
02 · The gaps / Attribution
08 / 19
One purchase · four claims

The same $120 sale, attributed four times.

SARAH 1 customer ONE SALE $120 Instagram claims $120 YouTube claims $120 TikTok claims $120 Google claims $120 Total reported · $480 · 4× over-counting
02 · The gaps / Aggregate
09 / 19
Aggregate level · the same problem at scale

Same data, different stories.

Platform-reported

Each silo reports 100% credit

What every dashboard shows on its own
Meta
$0.88M
YouTube
$0.82M
TikTok
$0.74M
Google
$0.85M

Reported total · $3.29M · ROAS inflated

What should be reported

One number, distributed across channels

What the truth looks like in aggregate
Meta
$0.32M
YouTube
$0.18M
TikTok
$0.14M
Google
$0.36M

Actual total · $1.0M · one truthful number

02 · The gaps / Diagnosis
10 / 19
Diagnosis

Three gaps in today's measurement.

GAP 1

The picture is incomplete

Today's tools miss what still drives outcomes: offline activity, cross-channel synergy, brand health, and competitor pressure.

What's broken
  • Offline blind spot
  • Cross-channel halo uncaptured
  • Brand equity untied to media
  • Competitor data isolated
GAP 2

Each platform tells a different story

The data exists, but no two systems agree, and stitching them together is a manual project rather than a tool feature.

What's broken
  • No single source of truth
  • Blended ROAS invisible
  • Dollar profitability unclear
  • Market share manual
GAP 3

Marketing doesn't speak finance

Connecting marketing effort to finance and leadership decisions stays a manual translation exercise, not a model output.

What's broken
  • Budget defense
  • Forecast & spend defense
  • Sell-in vs sell-out lag
  • Reports in marketing dialect
03 · The shift / Methodology
11 / 19
What is needed

Four steps from raw revenue to a defendable spend plan.

01 · DECOMPOSE

Pull revenue apart

REVENUE BASELINE DISTRIBUTION OFFLINE DIGITAL
02 · RANK ROI

True return per channel

Search4.20×
TV3.60×
Meta2.90×
OOH2.40×
TikTok1.80×
03 · HALO

Convert vs amplify

SOCIAL OTHER CHANNELS REVENUE awareness
04 · REALLOCATE

Same budget, better mix

CURRENT → OPTIMAL Current Optimal +18% SEARCH +$10K TV +$30K META −$8K OOH +$8K TIKTOK −$40K
03 · The shift
12 / 19
The shift from tracking to modeling

Don't take our word for it.

Cross‑media, holistic measurement is the only approach that captures the total contribution of advertising.

WFA · Cross‑Media Measurement Principles

Siloed measurement leads to siloed optimization. Channels work in synergy. Social amplifies Search, TV amplifies Digital.

Ipsos MMA

We've moved beyond last‑click. The honest measure of marketing is its incremental contribution to outcomes.

Google

We had to stop optimizing what was easy to track and start measuring what actually drove the business.

Marc Pritchard · Chief Brand Officer, P&G

Performance marketing made us short‑termist. We had to go back to measuring brand and base.

Keith Weed · former CMO, Unilever
mintveo 04 · Mintveo
13 / 19
Introducing

Mintveo.

Marketing analytics and automation that turns campaign data silos into the four things you actually want: insights, reporting, smarter budgets, and recommendations.

mintveo 04 · Mintveo / Team
14 / 19
Mintveo

Make Fortune 500 modeling customized for you

Our founder spent years at Kantar developing advanced modeling for the largest companies in the United States, and before that worked with companies that ran on the very same models.

Now we are building a team so your business has the same models, the same rigor, and the same edge.

Models we have built for
04 · Mintveo / Solution
15 / 19
How we solve it for each role

Built for your key decision makers.

For marketing

The picture, finally complete.

  • Offline made visible
  • Cross‑channel halo captured
  • Brand equity tied to media
  • Competitor pressure modeled
For finance

Marketing, in finance language.

  • Budget defense in dollars
  • Forecasts with confidence intervals
  • Sell‑in to sell‑out connection
  • Boardroom‑ready reports
For leadership

One number. One source of truth.

  • Blended ROAS, visible at the top
  • Dollar profitability per channel
  • Market share, automated
  • No manual stitching
mintveo 04 · Mintveo / Demo
16 / 19
Live

Demo.

A live walkthrough using GlowSkin, a fictional beauty brand.

Open Mintveo
04 · Mintveo / Data
17 / 19
Data inputs

What we model on.

Everything that moves your sales

2–3 years of weekly data
From your team
Sales by product group, by week
Shelf, POSM, OOH, sampling, in‑store digital
Meta, Google, TikTok, Snapchat, YouTube, Shopify
Amazon Ads, 3rd‑party retailer ads (Nahdi, Nice One, Ninja…)
Brand health, competitor data, market research
From Mintveo
Macro indicators, category trends, seasonality, weather
Inputs
Your data + Mintveo's context
Engine
Mintveo model
Outputs
Insights · Reports · Smarter budgets · Recommendations
04 · Mintveo / Timeline
18 / 19
Pilot timeline

From data shared to final outcome.

1

Data Sharing

Client shares all data with Mintveo

2

Data Preparation

Cleaning, transformation & validation

Data Review

Mintveo presents data review to client for approval

4

Modeling

Once approved, modeling begins

5

First Insights

Mintveo shares initial insights

Final Outcome

Follow‑up meeting to present final model outcome

Repeats every quarter
04 · Mintveo / Close
19 / 19
Mintveo × Beesline

Thank you.

Contact
walid@mintveo.com